Semtech LR20xx

Setting up the LoRaWAN Demonstration

IMPORTANT NOTE: The Raspberry Pi does NOT have a real-time clock (RTC) clock backup. When connected to the internet, it will use NTP to synchronize the time. If the Raspberry Pi is not connected to the internet, the time will not be synchronized and will continue from the time of the last shutdown. You can set the time on the command line by `sudo date -s "YYYY-MM-DD HH:MM:SS"` using the current date and time.

The LoRaWAN Demonstration

Overview

All of the functions core of the LoRa Plus™ Sales Demonstration Kit is a Raspberry Pi and it will serve as the nexus for all of the functions. The user will access the Raspberry Pi by connecting to the Wi-Fi AP hosted by the Raspberry Pi. Either a computer or a mobile device can be used to connect to the Wi-Fi AP; some functions may perform better on a computer but will be accessible on a mobile device. The LR20xx test device will be setup to send periodic messages to the ChirpStack network. The user will be able to view the messages in the ChirpStack web interface and in the Grafana dashboard.
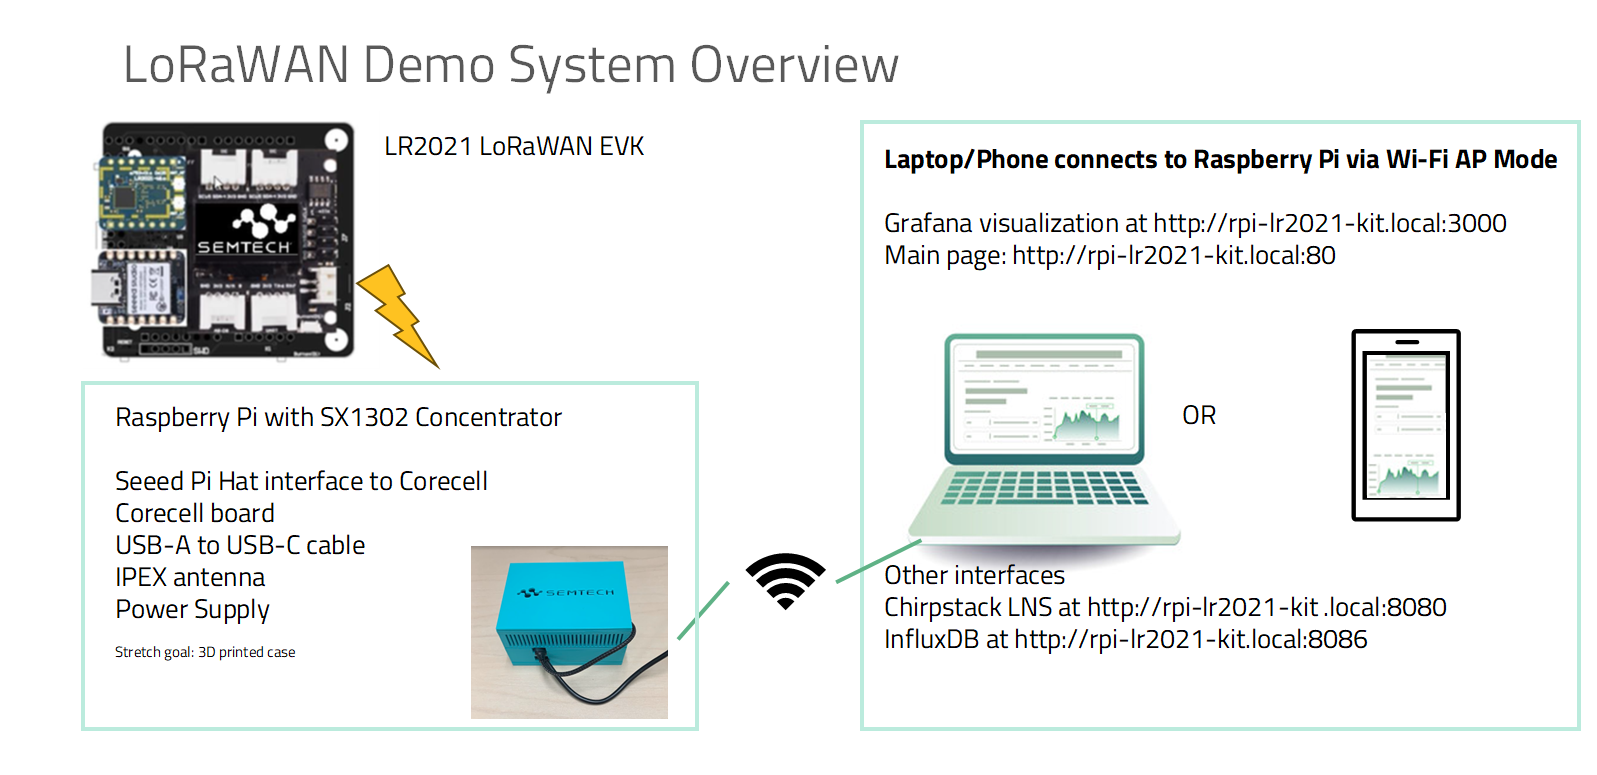
LoRaWAN Overview
Figure 2. LoRaWAN Overview

Setup

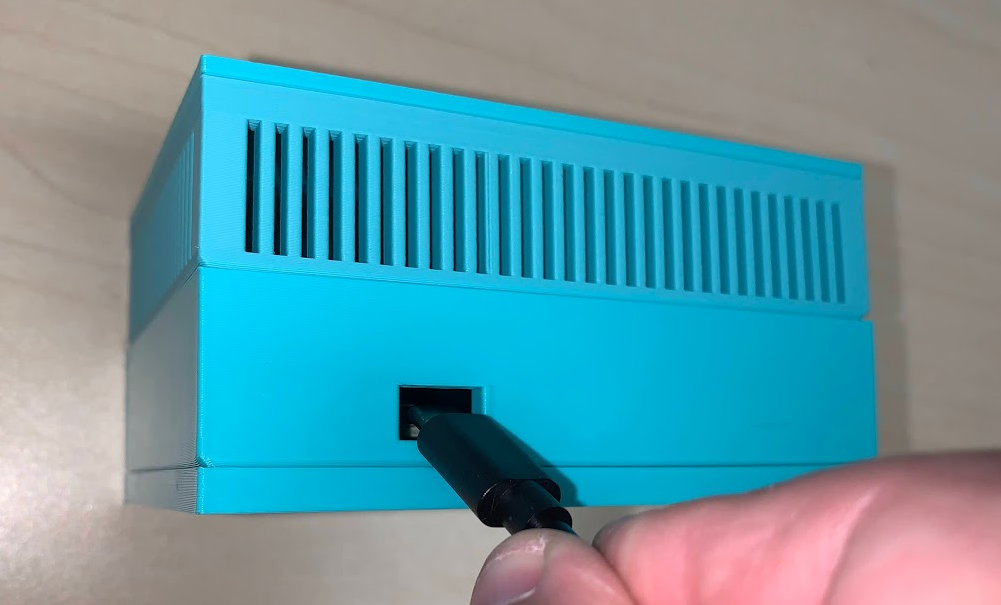
Apply power to the Raspberry

Plug In
Figure 3. Apply Raspberry-Pi-apply_power
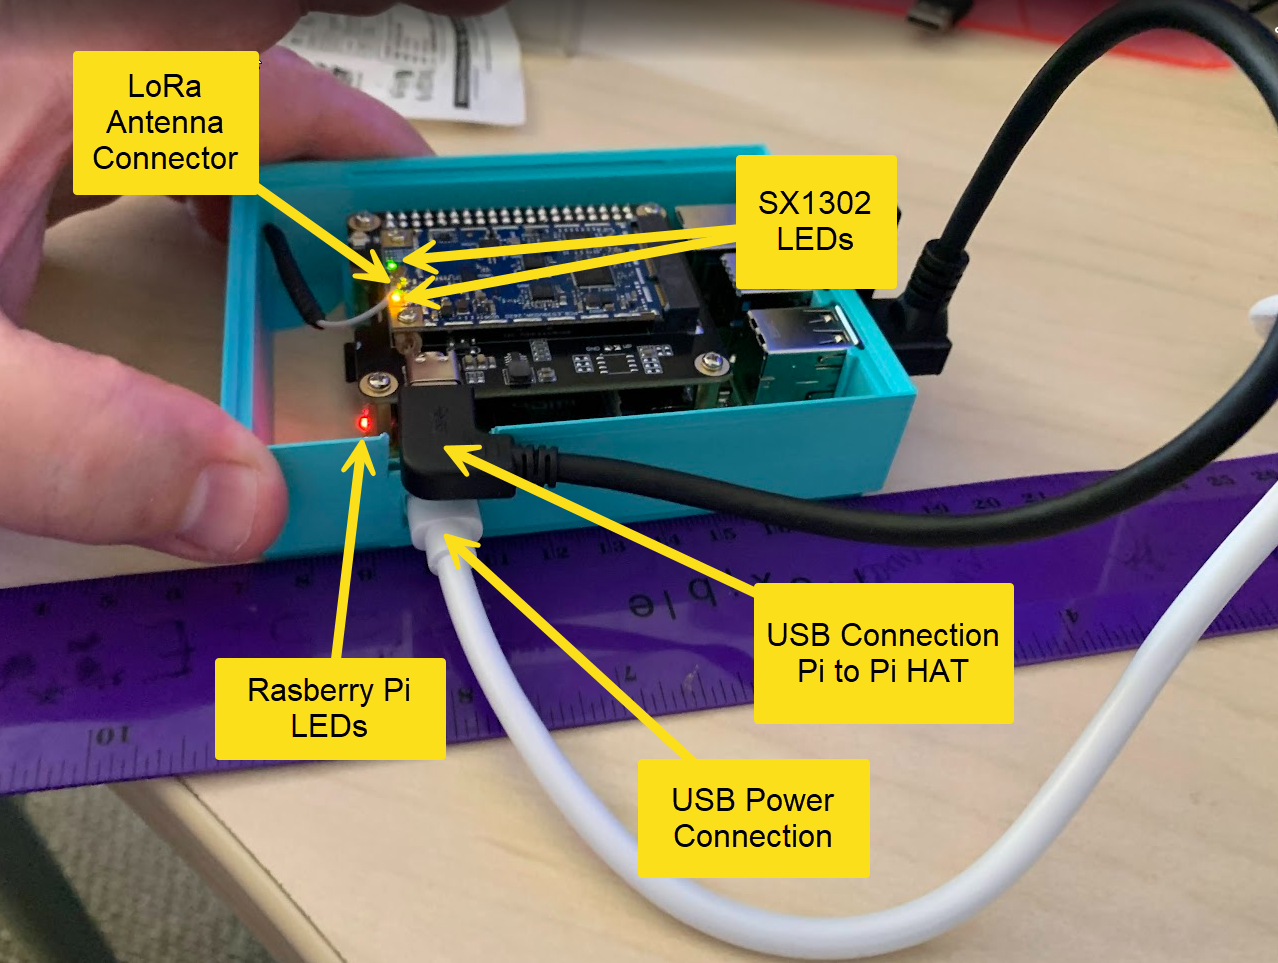
After applying power, check the following: Time Configuration: If not connected to the internet, set the correct system time using the following command:
sudo date -s "YYYY-MM-DD HH:MM:SS"

Example: sudo date -s "2025-01-27 14:30:00"

Raspberry
Figure 4. Raspberry Pi Hardware Setup
Once the Raspberry Pi hardware is operating. You can now setup the LoRa Plus™ test device. You will load the default binary into the unit and restart it to join the network and start sending messages.


Following the Raspberry Pi and device setup, the next step is to connect to the Wi-Fi AP hosted by the Raspberry Pi. The Wi-Fi AP is named "raspi-smtc-lan" and the password is "SemtecH!Lr2021".
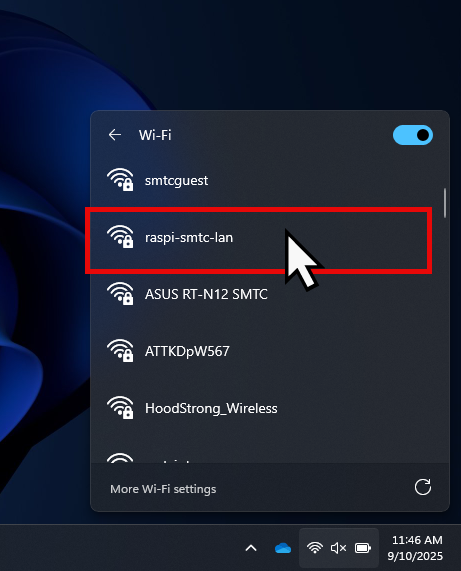
Raspberry
Figure 5. Raspberry Pi Wi-Fi AP Connection
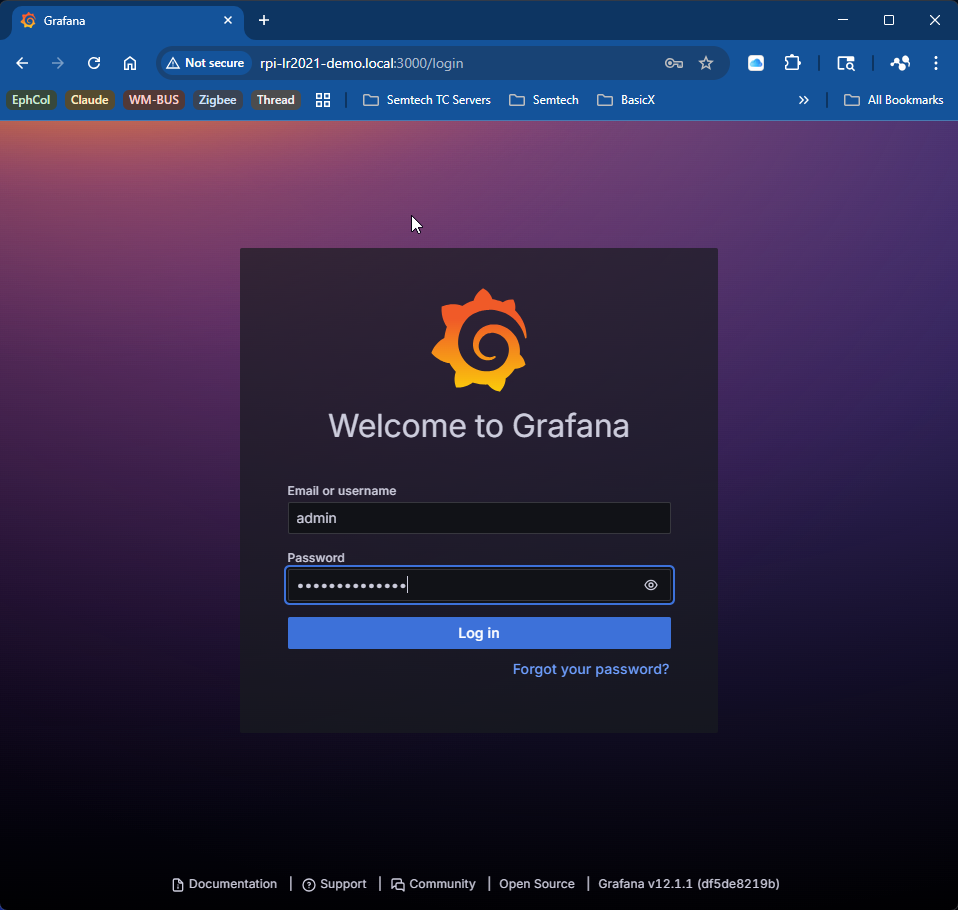
Once connected to the Wi-Fi AP, the user will be able to access the different services through a the web browser. The main visualization will be done at the Grafana main page (rpi-lr2021-demo.local:3000). The username is "admin" and the password is "SemtecH!Lr2021".
Grafana Login
Figure 6. Grafana Login
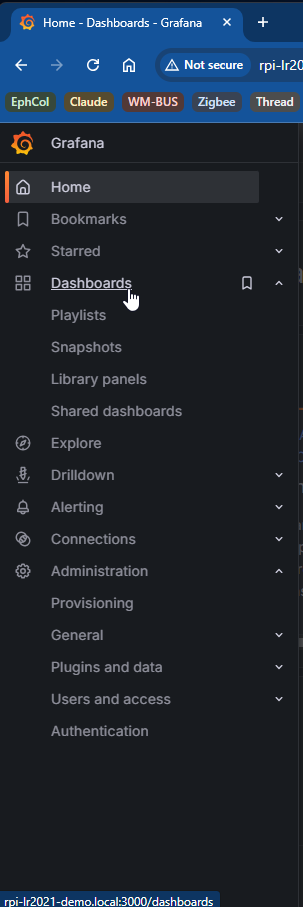
Once you are logged in, select "Dashboards" from the left menu:
Grafana Dashboards
Figure 7. Grafana Dashboards
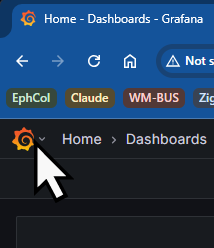
NOTE: If the menu list is not showing, open the menu dialog by clicking on the Grafana logo in the top left corner.
Grafana Menu

From the Dashboards page, select the "LoRaWAN Demo" dashboard:
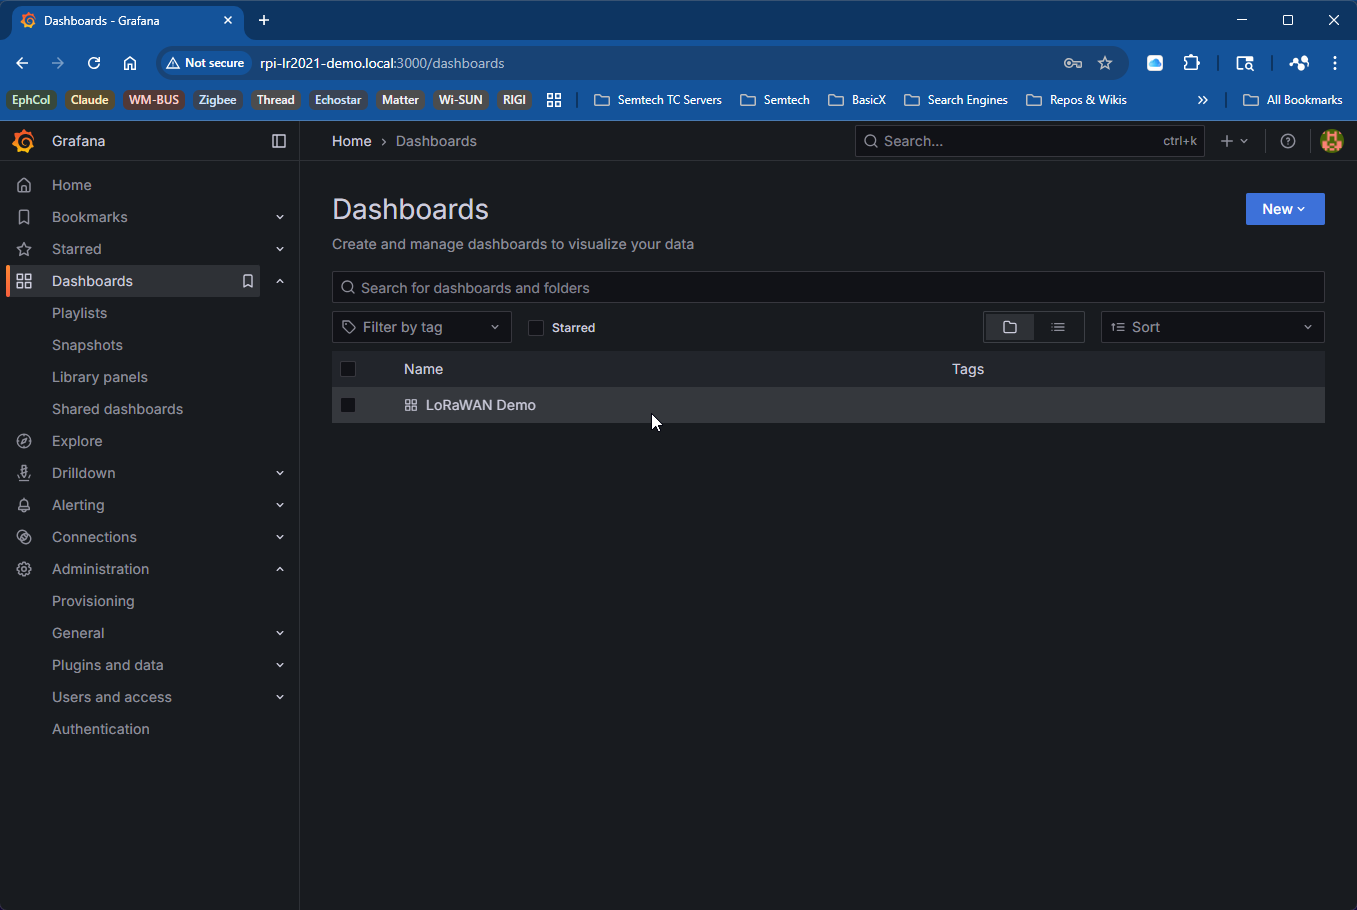
Grafana LoRaWAN Dashboard Select
Figure 8. Grafana LoRaWAN Dashboard Select

You should now see the LoRaWAN Demo dashboard:
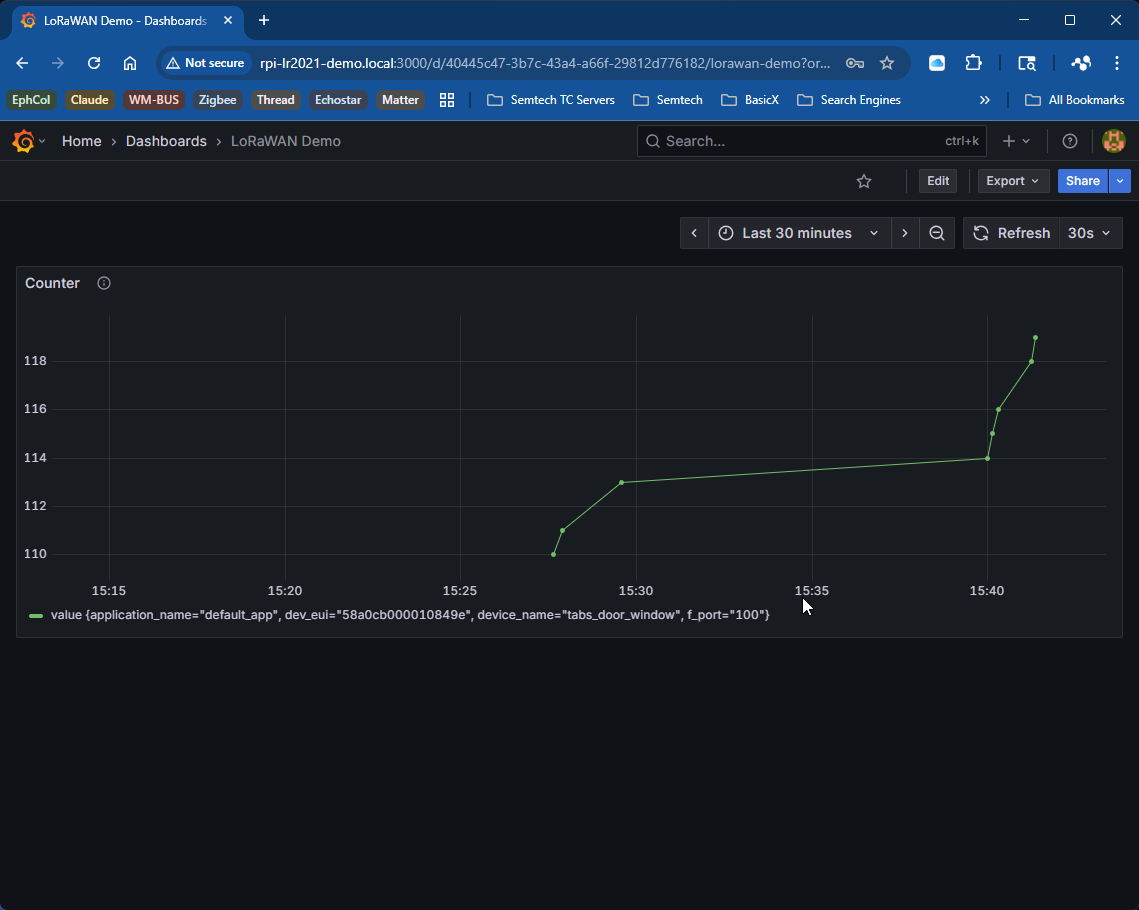
Grafana LoRaWAN Dashboard
Figure 9. Grafana LoRaWAN Dashboard

Key features on the dashboard include:
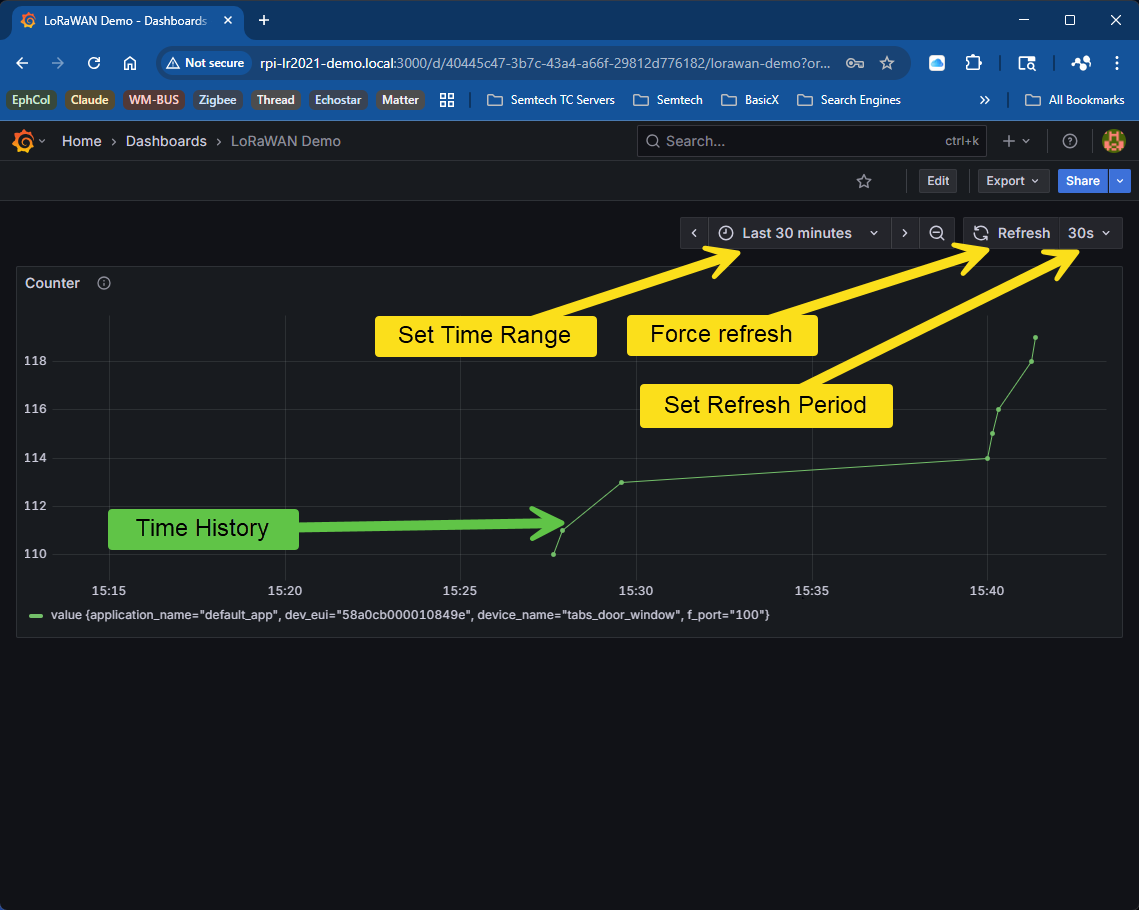
Grafana LoRaWAN Dashboard Annotated
Figure 10. Grafana LoRaWAN Dashboard Annotated